
Demand falls over Christmas and New Year as many of us are on leave but it quickly returns when we go back to work. In the chart below, I show our electricity use every hour between the beginning of December and 4th January when we return to work.
Demand falls over Christmas and New Year as many of us are on leave but it quickly returns when we go back to work.
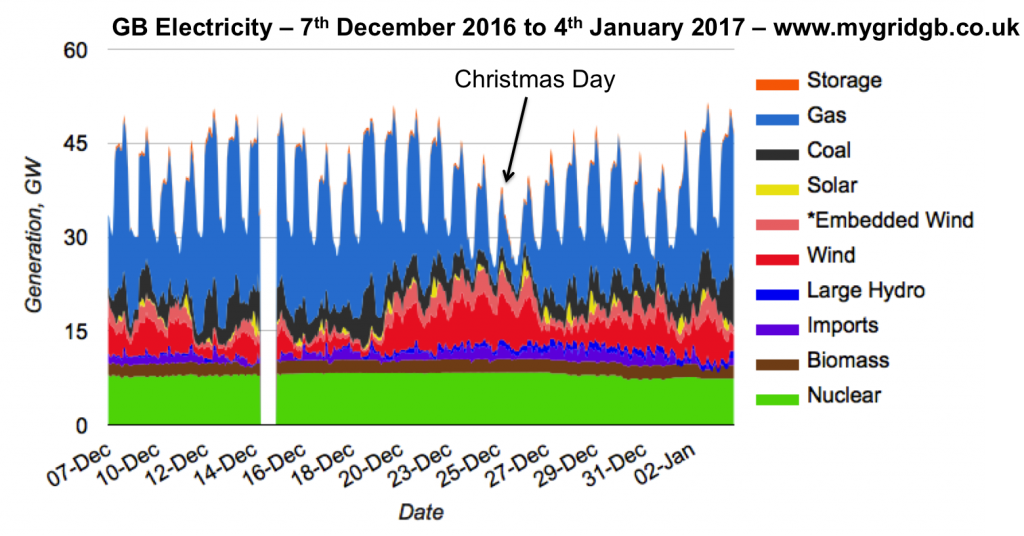
In the chart below, I show our electricity use every hour between the beginning of December and 4th January. You can see the big upsurge in wind between 20th and 27th December which was one of two reasons for the record amounts of renewable generation in Great Britain this Christmas.

If you look closely however, you will see how generation on the last two days of the chart are much higher than it was Christmas week. This is Tuesday 3rd and Wednesday 4th January: the days we returned to work.
Demand jumped from being mostly below 45GW over Christmas to being mostly above 45GW during the last two working days.
Peak demand on our first day back at work was nearly 35% higher than it was on Christmas Day.
National Grid have to meet the surge in demand otherwise the lights will go out. To understand how they did this, it is easier to zoom in a little on the above chart and look at electricity supply over the last week of the chart above.
In the chart below you can see how nuclear forms a baseload along with (to some extent) biomass. Imports, hydro, wind, solar and coal are added to this baseload. Gas and energy storage make up the difference between what our baseload and smaller generators produce and what we demand.
You can see the big evening peaks in demand on almost every day. These are typical in the winter as we watch TV, switch on light, cook etc. The majority of that peak is presently being met by gas, although some energy storage is being used. This is visible in the upswing in the “blue” gas in the chart and the orange spikes representing energy storage.
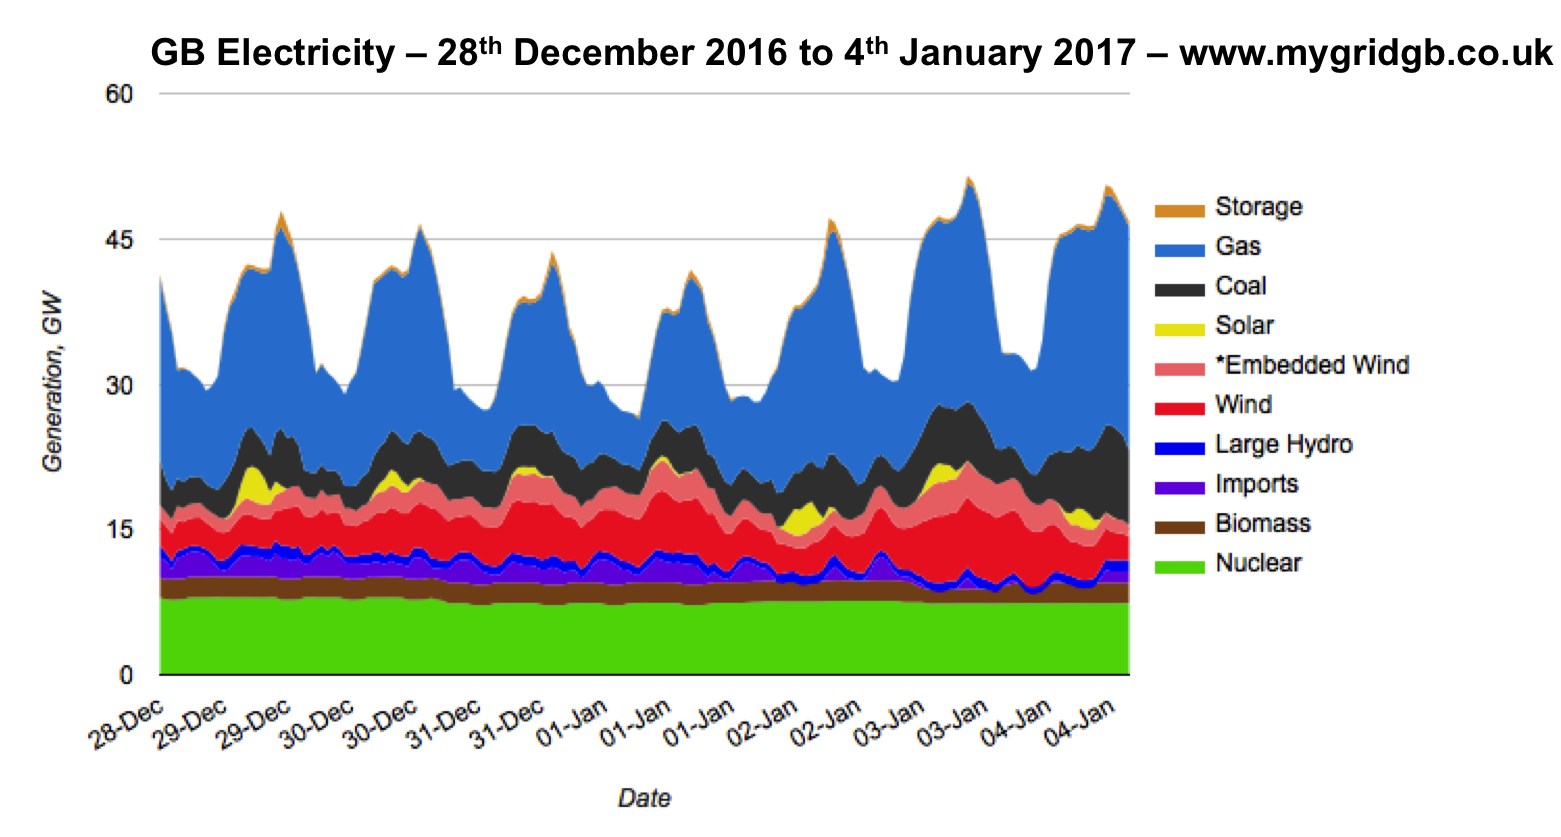
The flexibility of gas and energy storage mean that they provide much of the important services to balance supply of electricity and demand. They let us boil our kettles when we want them to boil and other forms of generation doesn’t yet provide this flexibility in our electricity grid.
As more and more renewables are placed into our network, some gas and much more energy storage will still be needed. My manifesto tries to tell this story. In future blogs, I will look at whether more low carbon energy could have to peak electricity over this period. My conclusions might well surprise you.