
Electricity is changing in the way it is being generated and also in how it is being used. At the end of 2015, I switched my house from incandescent/halogen lightbulbs to LED. In 2016, my family’s electricity consumption dropped by more than a third. But what is the carbon value in reducing our electrical demand?

Electricity is changing in the way it is being generated and also in how it is being used.
At the end of 2015, I switched my house from incandescent/halogen lightbulbs to LED. In 2016, my family’s electricity consumption dropped by more than a third.
You may also have noticed that councils are beginning to install LED street lighting. This is because they are more efficient and longer lasting than older lights – and have fast paybacks.

An LED streetlight alongside an old fashioned light in Aberdeen
Being more efficiency with energy reduces our electrical demand. This is why energy efficiency is often seen as the “third way” of reducing carbon emissions. Can this have a big impact?
The National Impact of Energy Efficiency
My analysis has shown that being more efficient has a disproportionate impact in reducing the amount of carbon Britain’s electricity system produces.
This because I assume that there is a the merit order to deciding which power stations are selected to provide electricity (based on observations of the grid data this year):
- Britain’s nuclear generators run without interruption (see here).
- Wind, hydro and solar power is taken when it is generated and rarely curtailed.
- The shortfall between what the above plants produce and the electricity demand is (mostly) made up of fossil fuel power stations along with some biomass, imports and storage.
That means that, reducing demand will usually reduce fossil fuel generation first.
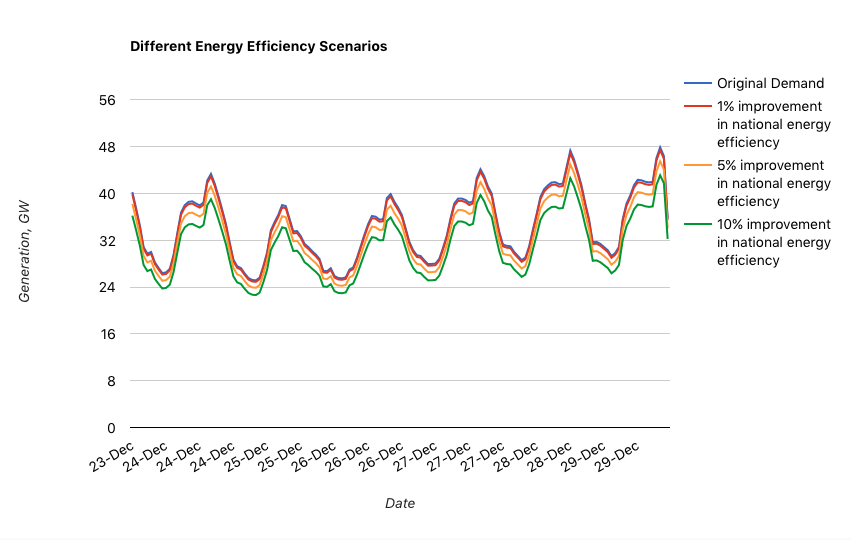
I have been through the past 150 days of electricity data (1st August to 29th December 2016) and reduced Britain’s electricity demand by 1%, 5% and 10%. In my model, this reduction hits the coal power stations first, followed by gas plants. The energy efficiency can come from fridges, computers, lighting.
The chart below shows the different efficiency improvements over the last days of December. I have applied the reduction uniformly across the day to keep things simple.
So what do the numbers show:
- Over the 150 day period I assessed, Britain’s electricity grid produced 332 grams of CO2 equivalent per kWh of electricity.
- The Committee on Climate Change looks at reducing emissions to below 100 gCO2eq/kWh by 2030
- A 1% improvement in efficiency would have reduced carbon intensity by 1.48%
- A 5% improvement in efficiency would have reduced carbon intensity by 7.70%
- A 10% improvement in efficiency would have reduced carbon intensity by 15.25%
That means a 1% efficiency improvement has a more than 1% improvement in carbon emissions! So both my family my local councils have saved money and had a disproportionate effect on carbon emissions.
Time to look at new lightbulbs for the rest of my family…