
British news is dominated by the devastation caused Storm Doris over the past 24 hours. No doubt somewhere in the papers will be photos of a wind turbine which fell down, caught fire or was switched off in high winds – for some typical headlines on the matter, click here.
Photographs of exploding wind turbines of course don’t present a complete picture. In this blog we see how much low carbon energy these fantastic pieces of complex engineering generated and see what that teaches all of us about a future low carbon energy supply.
The chart below shows all forms of electricity generation in Britain over the past 7 days (16-23 February 2017) with wind generation is shown in red. In the days preceding Storm Doris, wind output was relatively high and over the past week it generated nearly 17% of British electricity.
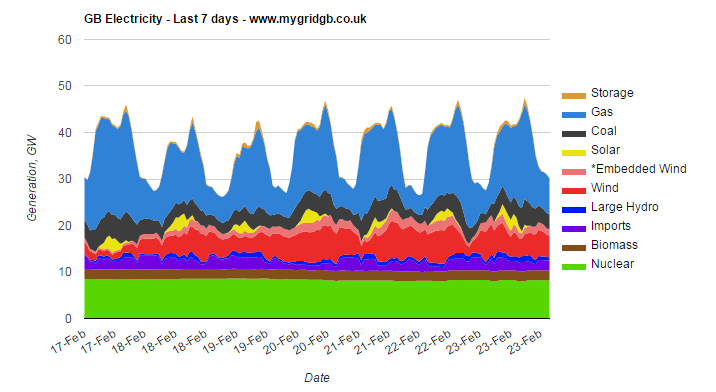
The “calm before the storm” can be seen occurring overnight on 22nd when wind output drops before returning when the storm hit on 23rd February. The data shows that the thousands of turbines which withstood Storm Doris continued to generate large amounts of low carbon electricity.
All wind turbines are designed to switch off or be curtailed in extremely high winds and some will undoubtedly have done so during the storm. What is crucial to understanding wind energy is that not all turbines would have been curtailed at the same time. In the data in my chart we see that the wind output in Britain did not suddenly collapse during the storm. It didn’t matter that strong gusts curtailed turbines in a particular wind farm because other turbines remained on. The wind output fluctuated but that fluctuation was managed by flexibility in our electricity system.
As a result, low carbon sources (including nuclear power and low carbon imports) provided over 50% of British electricity over the past week. The combined result of the thousands of wind turbines spread across Britain was a significant contribution to our electricity.
The evidence this week also shows that more wind turbines could well be a good thing. That certainly appears to be UK Government Policy. My manifesto explores a future whereby there is more wind, solar, nuclear and storage in the British electricity system. My argument is that sufficient additional low carbon generation will result in sustainable greenhouse gas emissions. The proposed generation mix under the manifesto is illustrated on the diagram below.
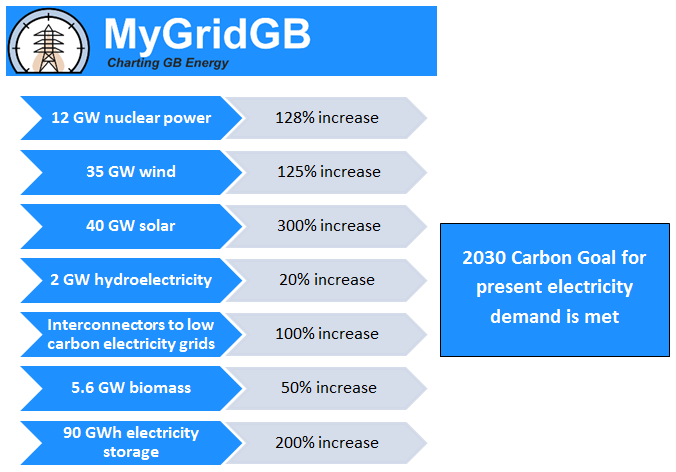
Under my proposed manifesto, there is shown to be sufficient days and weeks of very low carbon electricity to permit a limited amount of high carbon generation. Put more simply, if Britain only uses gas power stations when it is dark and still, then we can meet our carbon goals and save fossil fuels for when we need them most.
I simulate the manifesto in real time on this website and the chart below shows what our electricity generation would have looked like had the manifesto been implemented. In the chart you can see how nuclear provides a baseload alongside some biomass; wind and solar work in conjunction with a modest expansion in energy storage to provide bulk energy; and gas/imports are used on dark or still days to provide backup power.
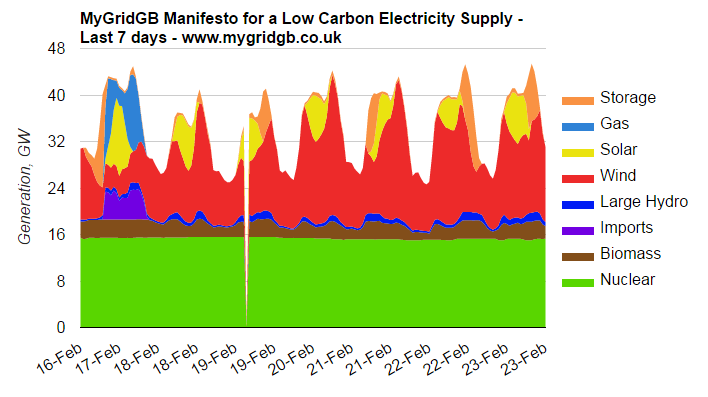
This week was one where there would have been sufficient wind and sun to provide 100% low carbon energy for six days running. This is quite clear on the chart above with all the days of red wind power and yellow solar power shown. It also perfectly illustrates that although Britain would have needed gas power stations on one day this week, overall a very low carbon electricity system is still provided. You can view the last 28 days under the manifesto by looking clicking to view the “manifesto tracker” on this website.
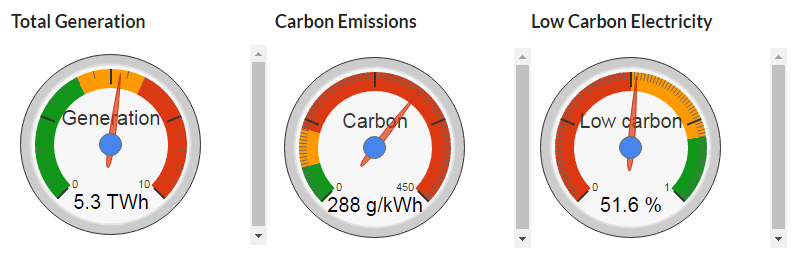
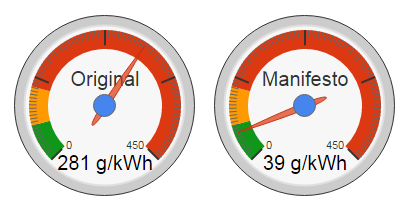
In real life, British electricity had average greenhouse gas emissions of 283 g/kWh over the last 7 days with a target by 2030 of releasing 50-100 g/kWh. Under my manifesto, British electricity would have generated the same amount of electricity but released just 39 g/kWh of greenhouse gas.
Gas would have only been required on 17th February when the weather was still. Wind, solar, storage and nuclear power provided 100% low carbon electricity the rest of the time.
The manifesto proves that adding modest amounts of low carbon wind, solar and nuclear that we can meet our goals for low carbon electricity. The results shown this week are born out month after month and you can see the results for yourself on my website. Please take a look, share and add your own comments.
If MyGridGB is about providing real data on electricity generation, the Manifesto is about demonstrating that a low carbon future is not difficult to achieve. There will be weeks where there is little wind, indeed there will be a “calm after Storm Doris”, but building low carbon renewable generators to capture the wind when it is there is a good thing.
Summary:
- Wind provided nearly 17% of British electricity between 17th and 23rd February. Electricity was 51% low carbon.
- Under the MyGridGB manifesto, British electricity would have been 100% low carbon for 6 of the past 7 days had it been implemented
- Carbon emissions dropped to 283 g/kWh over this week. Under the MyGridGB manifesto, it would have been 38 g/kWh.